Online Plot Digitizer for Your Graphical Data
Extract Data From Graphs and Reuse It in Your Code

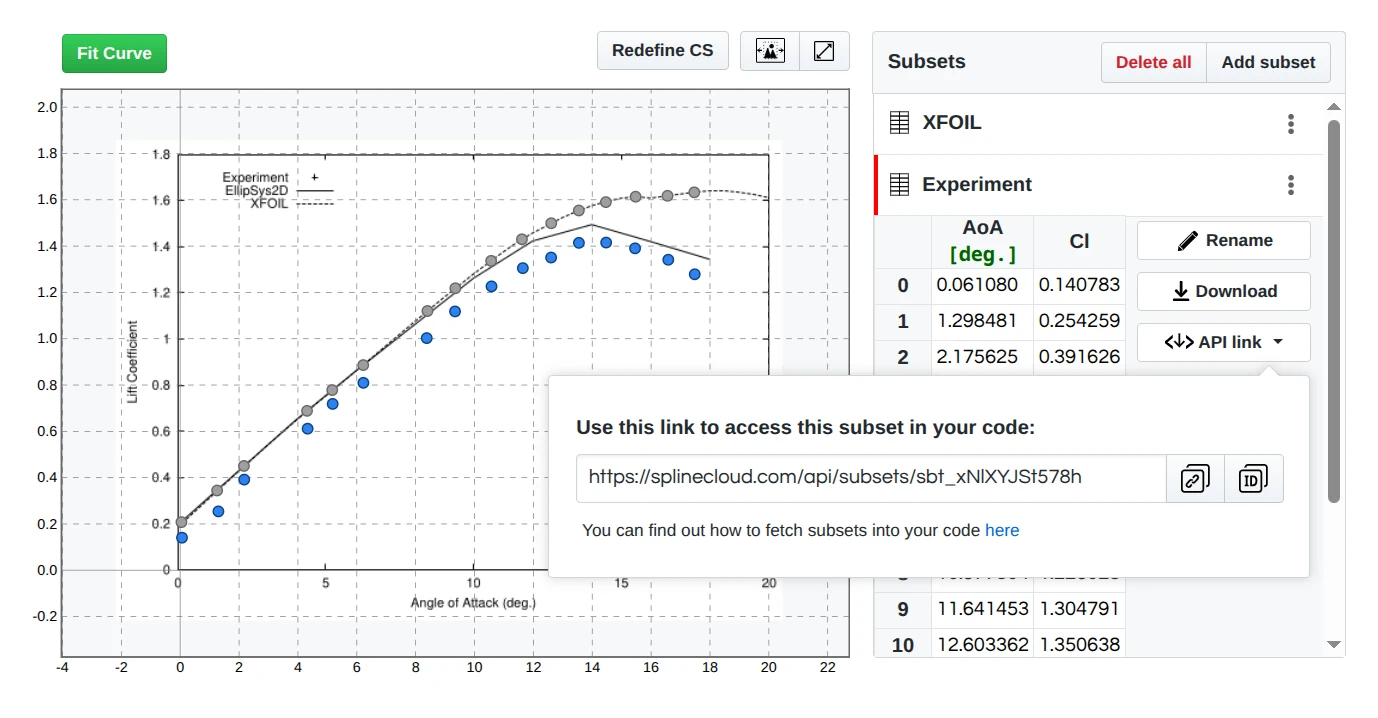
with our free plot digitizer tool:

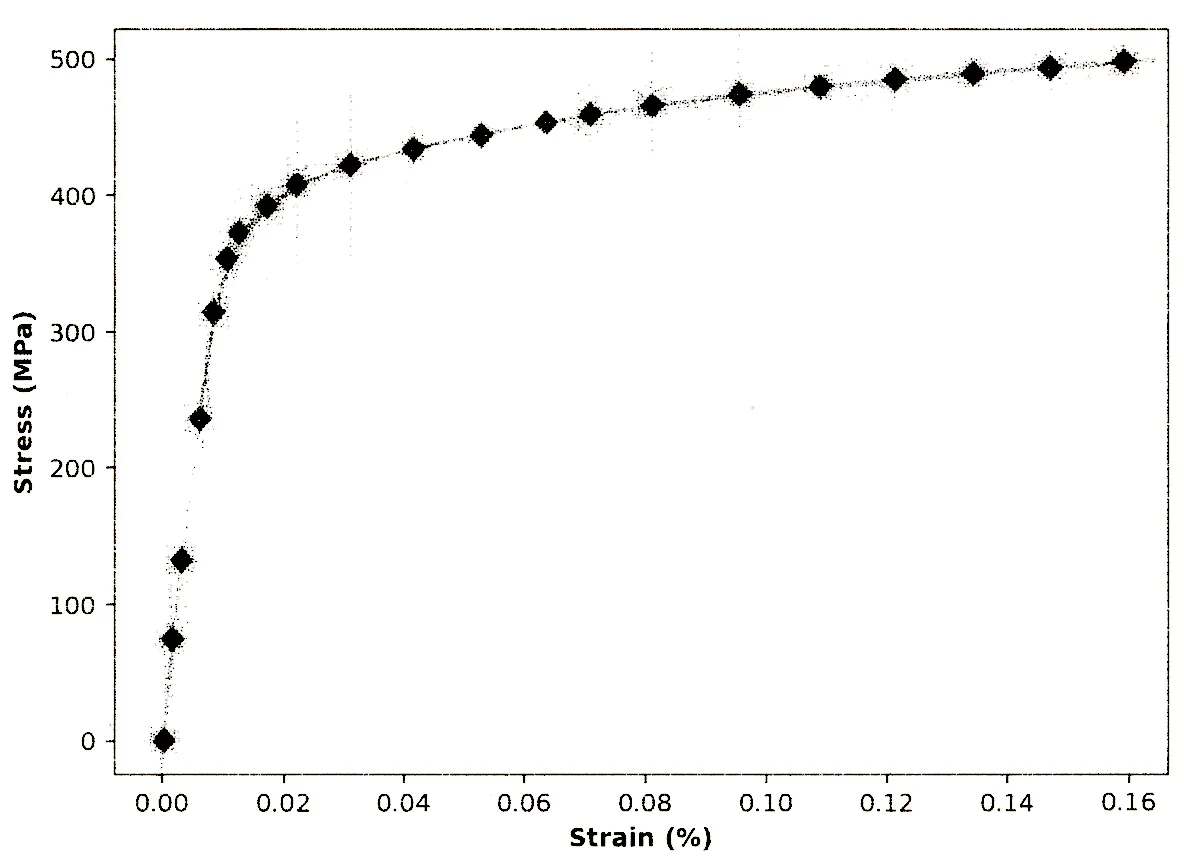
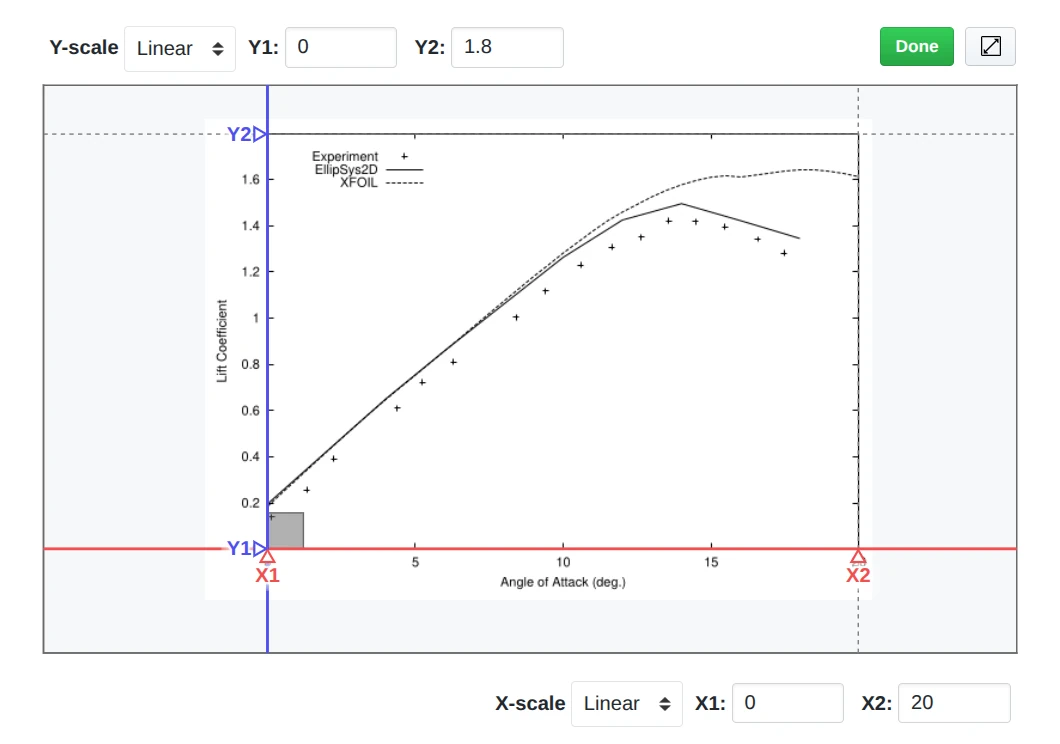
  • extract data from scanned plots and images,
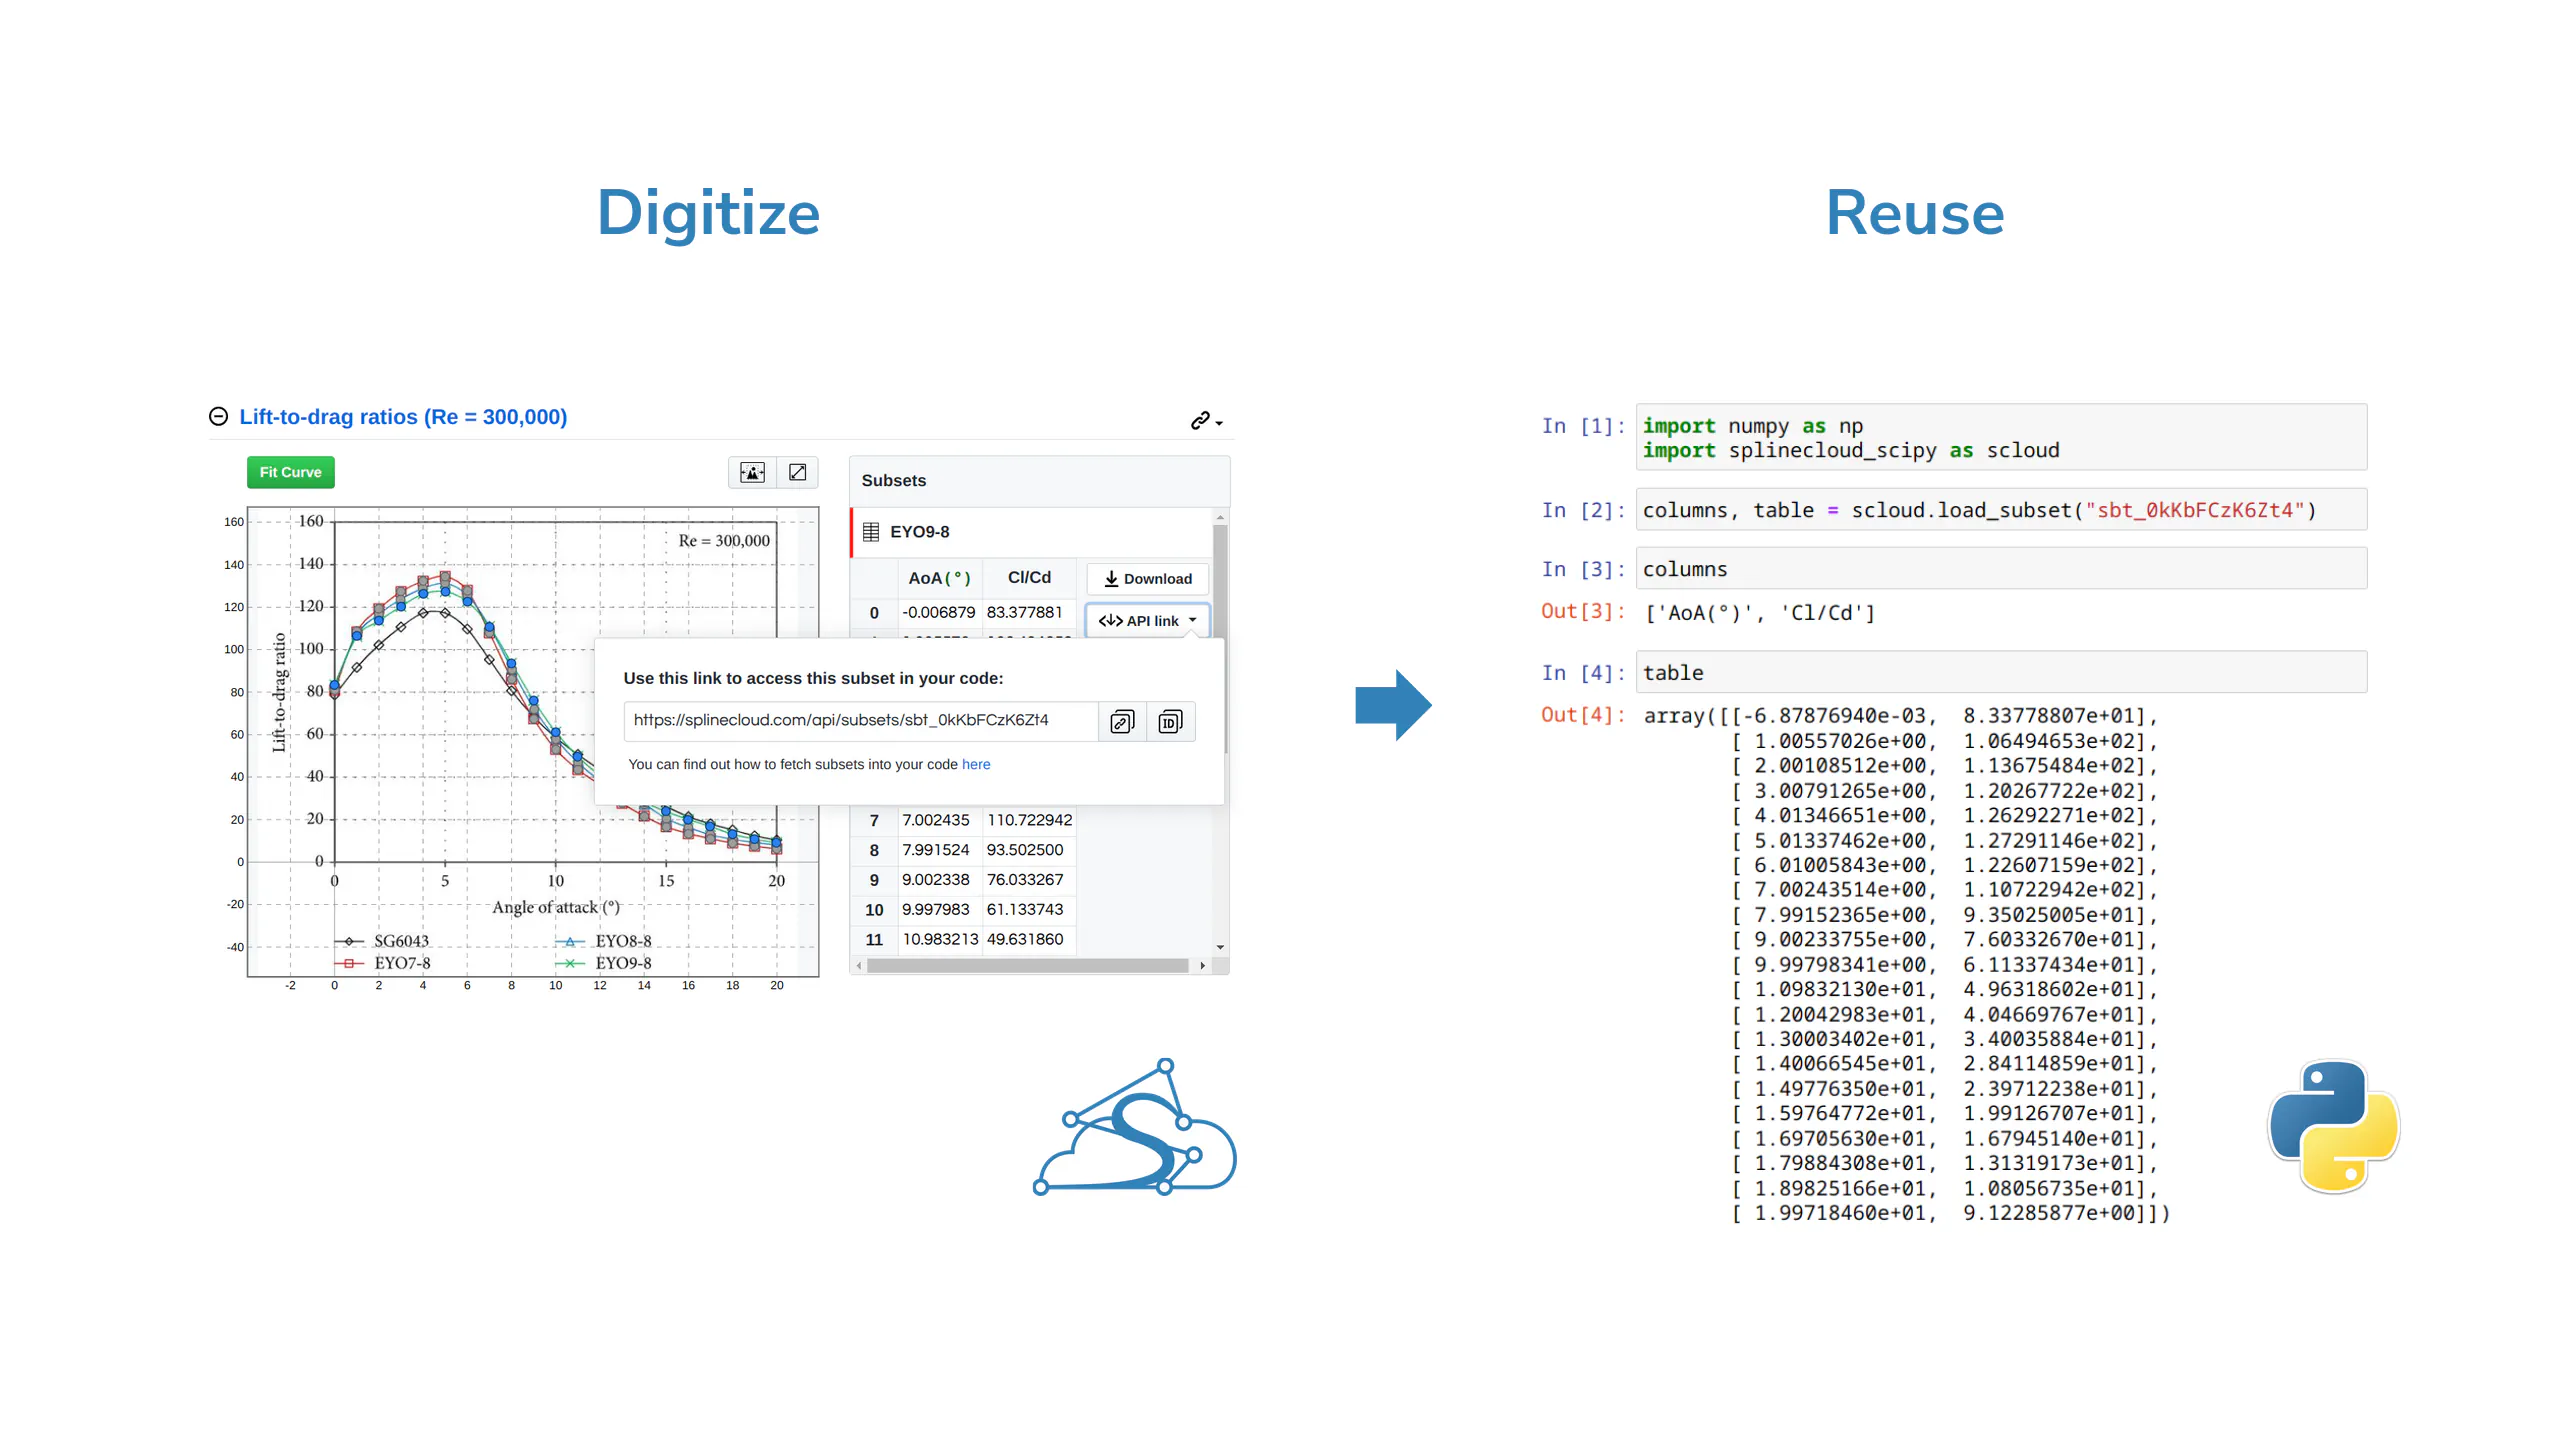
  • store and share datasets on SplineCloud,
  • access datasets directly from your code,
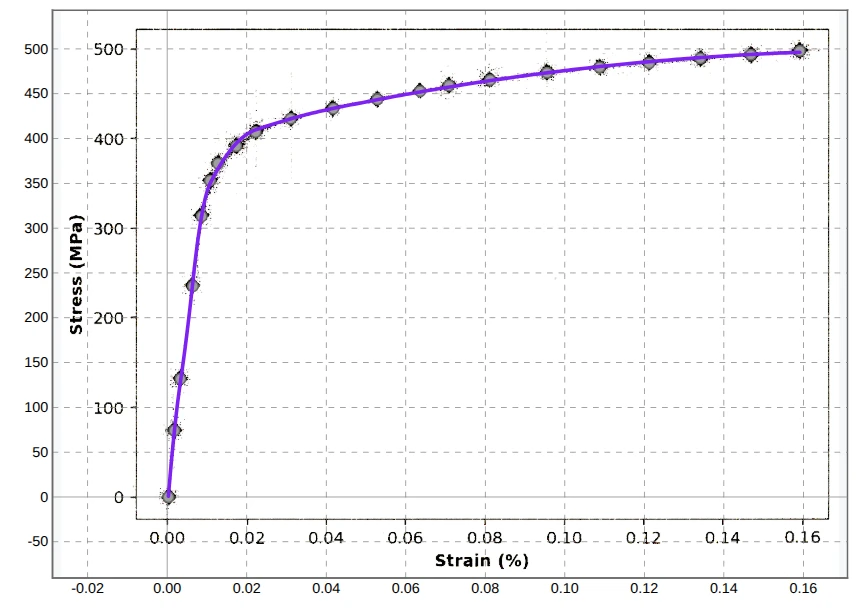
  • instantly fit curves to the extracted data.
Plot digitizer tool Extracted data from plot

Create Your Free Account

Get Started

Benefits of SplineCloud’s Free Plot Digitizer Tool

the features that ensure you get the job done quickly with our plot digitizer free online solution


No need to install anything on your system – use our plot digitizer online free tool with your desktop browser

We provide an intuitive 3-step workflow to digitize a plot: define axes -> set scale -> pick data points

Our plot digitizer software provides the ability to zoom into the plot to achieve better positioning of axes and data points

Once digitized, your data remains in the cloud and can be reused later and shared with others

Digitized datasets and subsets get their IDs and can be accessed over SplineCloud API or downloaded in a 'csv' format

Once data is extracted from an image, you can find the best fit for it directly on SplineCloud without the need to use side services and tools


Digitize Your Graphs

A Few Steps To Use Our Web Plot Digitizer Tool

a simple workflow with our free plot digitizer tool, explained in several steps


Fit Curves To Your Plots

apply curve fitting for the extracted datasets, adjust curve shapes interactively, and reuse them in your code

Stress-Strain Test Plot
Curve Fitted To Stress-Strain Test Plot

Learn More About Our Online Plot Digitizer

watch the video explaining SplineCloud's approach to plot digitizing


SplineCloud Plot Digitizer Video Guide

Turning Graphs Into Code-ready Datasets with SplineCloud


Typical Use Cases for the Online Plot Digitizer

Extract X–Y data points from published plots, charts, and figures when raw data is not provided.

Convert aerodynamic polars, thrust curves, lift/drag coefficients, engine maps, pump performance charts, and other engineering diagrams into structured datasets.

Recover experimental data from PDFs, hand-drawn plots, or scanned measurement sheets.

Digitize stress-strain diagrams, fatigue curves, S-N plots, creep and relaxation curves, temperature-dependent material properties, and more.

Recover performance curves locked inside manufacturer datasheets and convert them into reusable digital data for further design and analysis in your code.

Overlay datasets digitized from different publications or reports to analyze variations, trends, and discrepancies.

Transform Your Data Processing and Modeling Workflows