Digitizing Plots with SplineCloud

Nowadays engineers and scientists rely heavily on data and the story it tells. Regardless of the domain of study or data size, whether it is a collection of astronomical observations, or the results of subtle numerical simulations, or material properties tests, the insights that data represents have to be found and represented in a form that allows to build further predictions and models.

All modern analytical software packages and applications work with common digital data formats, like spreadsheets (xls, xlsx, odf, odt, other), and text data (txt, csv, other). However, not all data that researchers can access is represented in these digital formats. Many times, researchers encounter image plots that need to be digitized for further analysis. This is where the tools for plot digitizing become handy.

In this brief article, you will get a picture of how to digitize graphical data with our free online plot digitizer.


The SplineCloud Approach to Digitizing Plots

The process of digitizing plots involves converting visually represented data into a structured, numerical format. SplineCloud achieves this by allowing users to define a digital coordinate system and data points on top of the image. Digitized data can be downloaded or accessed over SplineCloud API.

SplineCloud allows to digitize several plots on the same image by creating new datasets and map several data ranges on the same plot by creating new subsets. Digitized data can then be shared with others and used to find models that fit the relation it represents with the help of the integrated curve fitting tool.


Benefits of Using SplineCloud’s Plot Digitizer Tool

Several online and desktop tools for digitizing plots are out there, however, SplineCloud provides a range of important features that ensure you get the job done quickly and have no extra hustle with reusing data in further analysis.

  1. Web-based
    No need to install anything on your system – use our free web plot digitizer tool using your desktop browser (no mobile support is available as of now).

  2. Simplicity
    We provide an intuitive 3-step workflow to digitize plot: pick axes -> set scale -> pick data points.

  3. Accuracy
    Our plot digitizer provides the ability to scale deep into the plot to achieve better positioning of axes and data points.

  4. Data Preservation
    Once digitized, your data remains in the cloud and can be reused later and shared with others.

  5. Accessibility
    Digitized datasets and subsets get their IDs and can be accessed over SplineCloud API or downloaded in a csv format.

  6. Seamless Curve Fitting
    Once data is extracted from an image, you can find the best fit for it directly on SplineCloud without the need to use side services and tools.


How To Use SplineCloud’s Plot Digitizer Tool?

Let me guide you through the workflow - it is very simple and consists of three main steps:


Step 1

Create a public repository on SplineCloud and upload your plot. SplineCloud supports "jpg", "jpeg", "png", "bmp" and "webp" formats. Your image can contain one or several plots.

Dataset With Plot
Dataset With Plot

Step 2

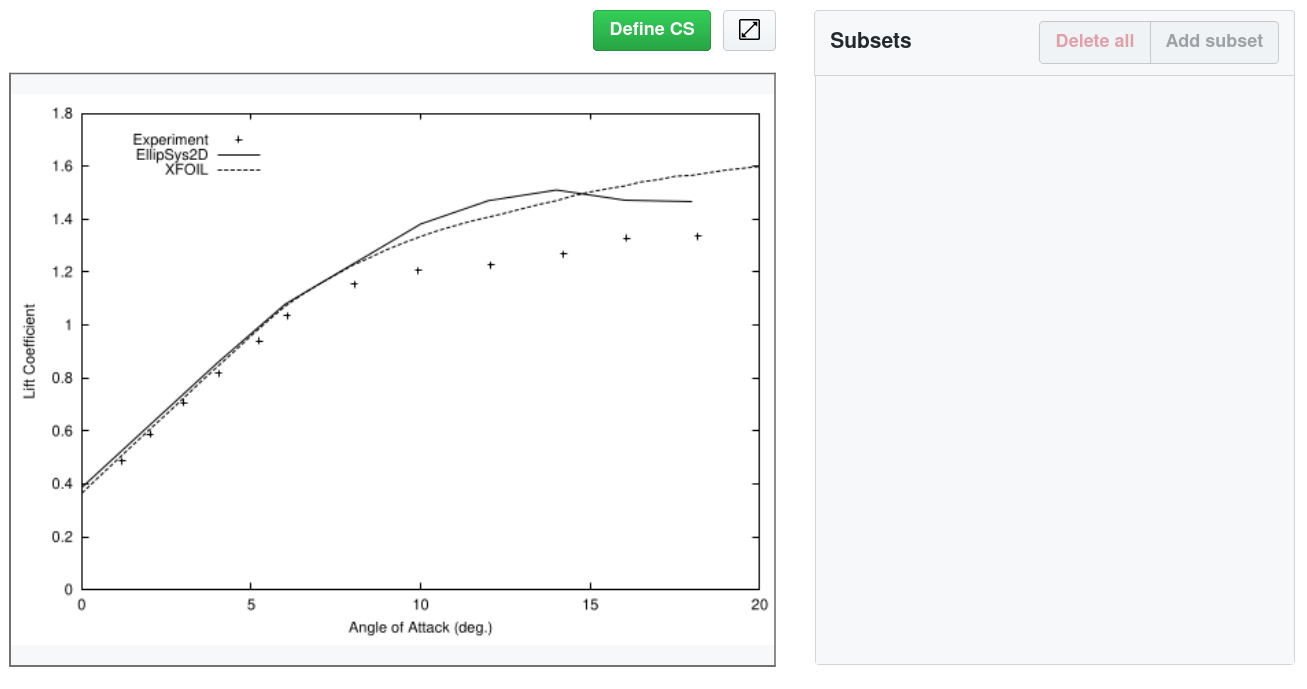
Click the “Define CS” button to set up the coordinate system. Place CS origin to the plot origin. You can scroll in and out to adjust the scale and achieve higher positioning accuracy. Use a square handle to drag the CS origin if needed.

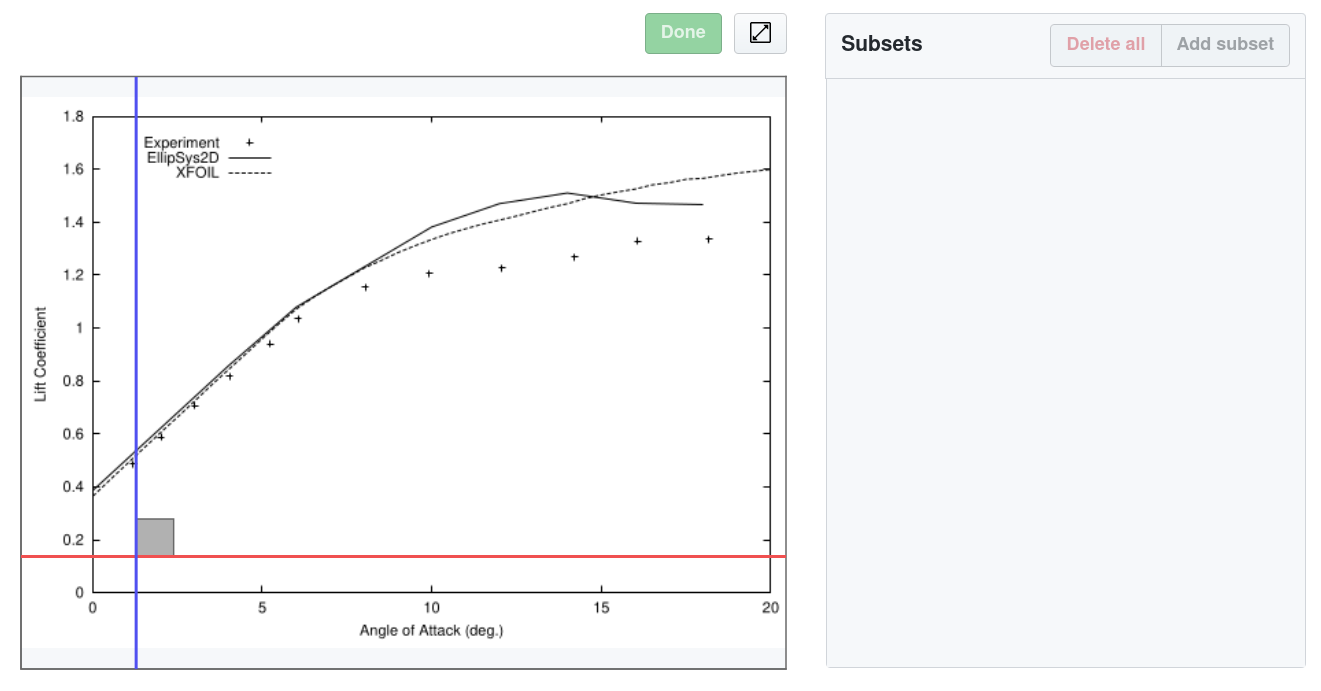
Defining Coordinate System of the Plot

After placing the origin, adjust the positions of the bounding handles across the X and Y axes and set corresponding values to the input fields. Click “Done”.

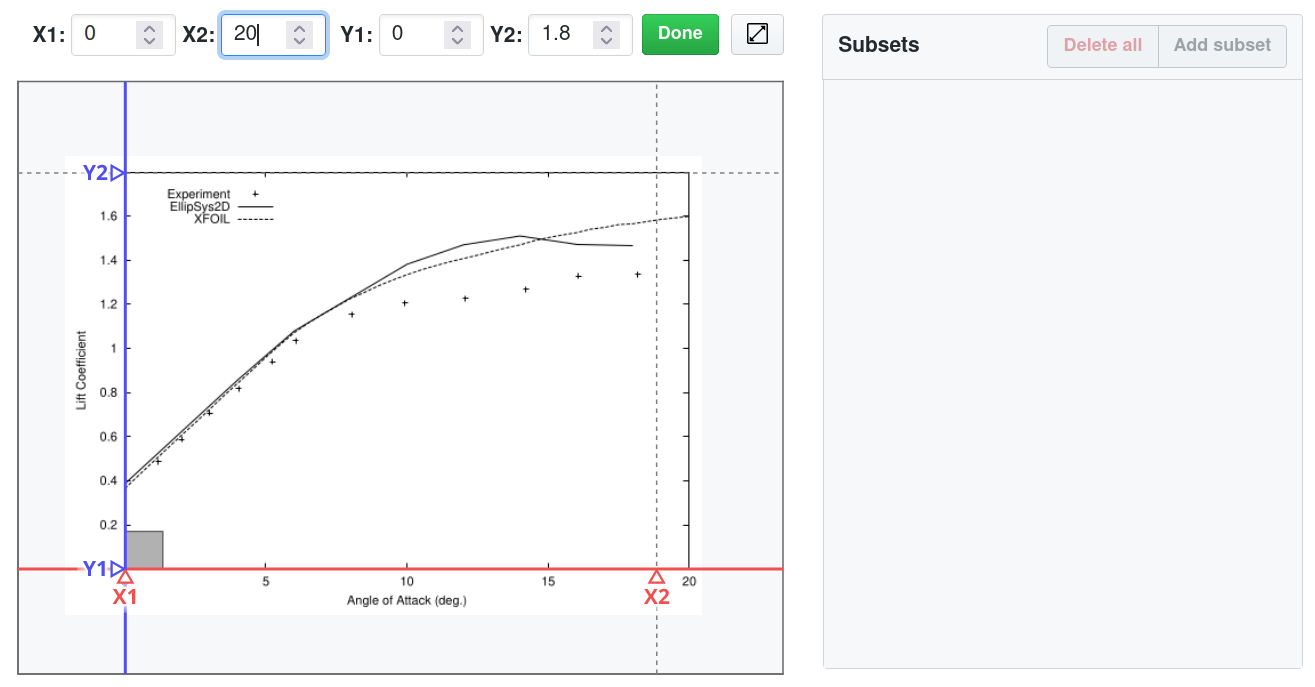
Selecting Boundary Values Along the Axes

Step 3

Now, when the digital coordinate system is mapped to the image plot, you can proceed with picking data points on the widget with a double click. Scroll in and out to adjust the plot scale. You can also drag points to achieve higher positioning accuracy.

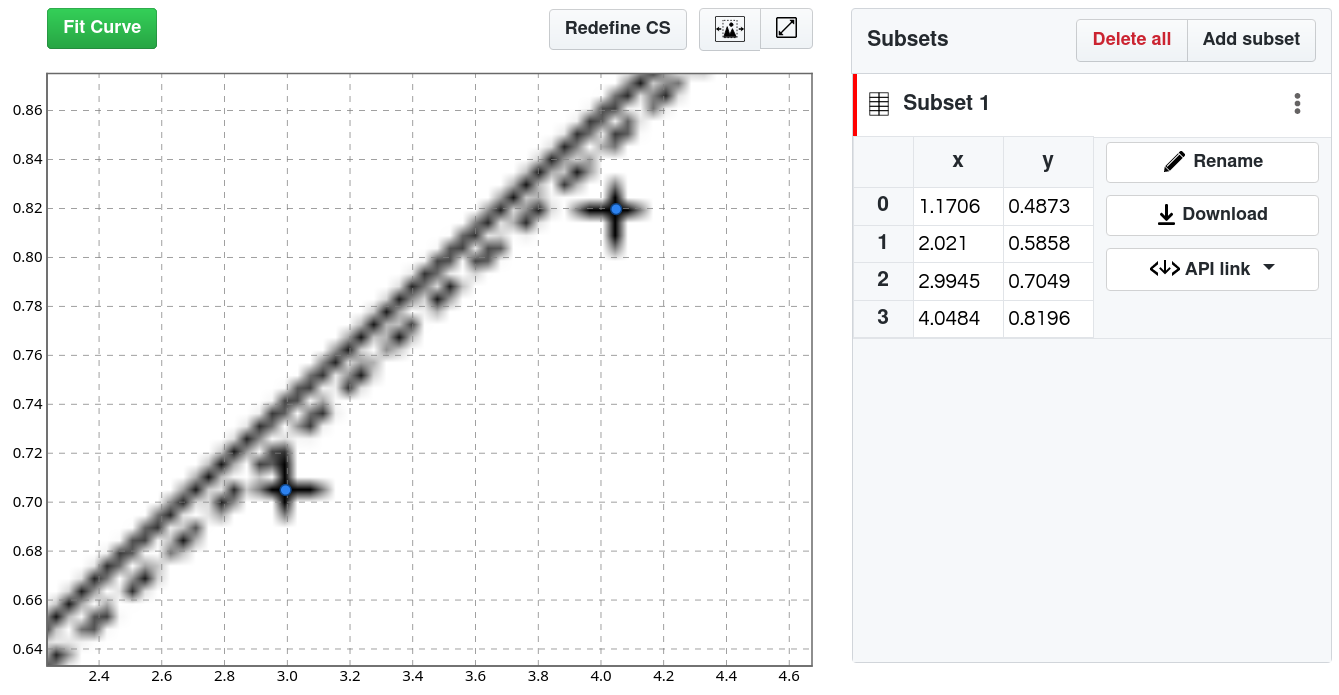
Selecting Data Points
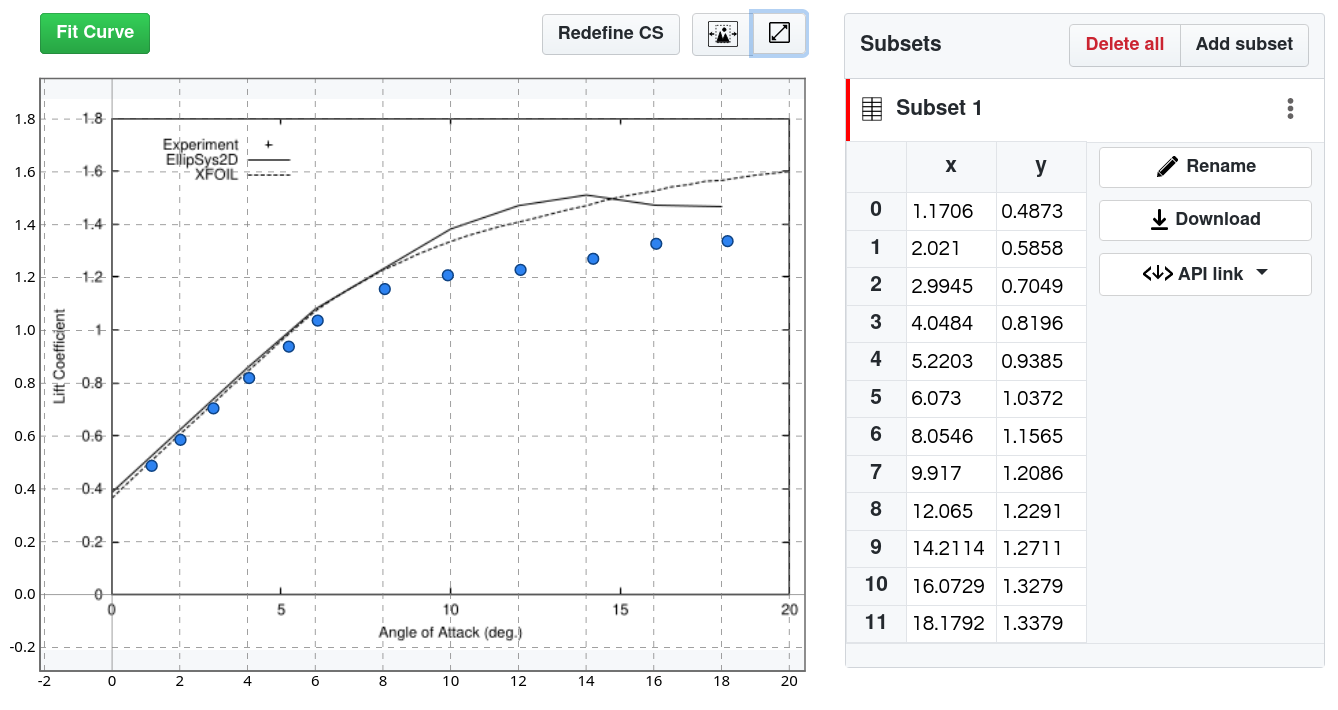
Digitized Data on the Plot

After you pick all data points reset the scale with a control button on the top right of the widget. You can add new subsets if your plot contains several ranges of data or several curves. If your image contains several plots click the “New Dataset” button on the top right of the page and repeat the procedure for another plot.

Click the “Fit Curve” button to proceed to the curve fitting.

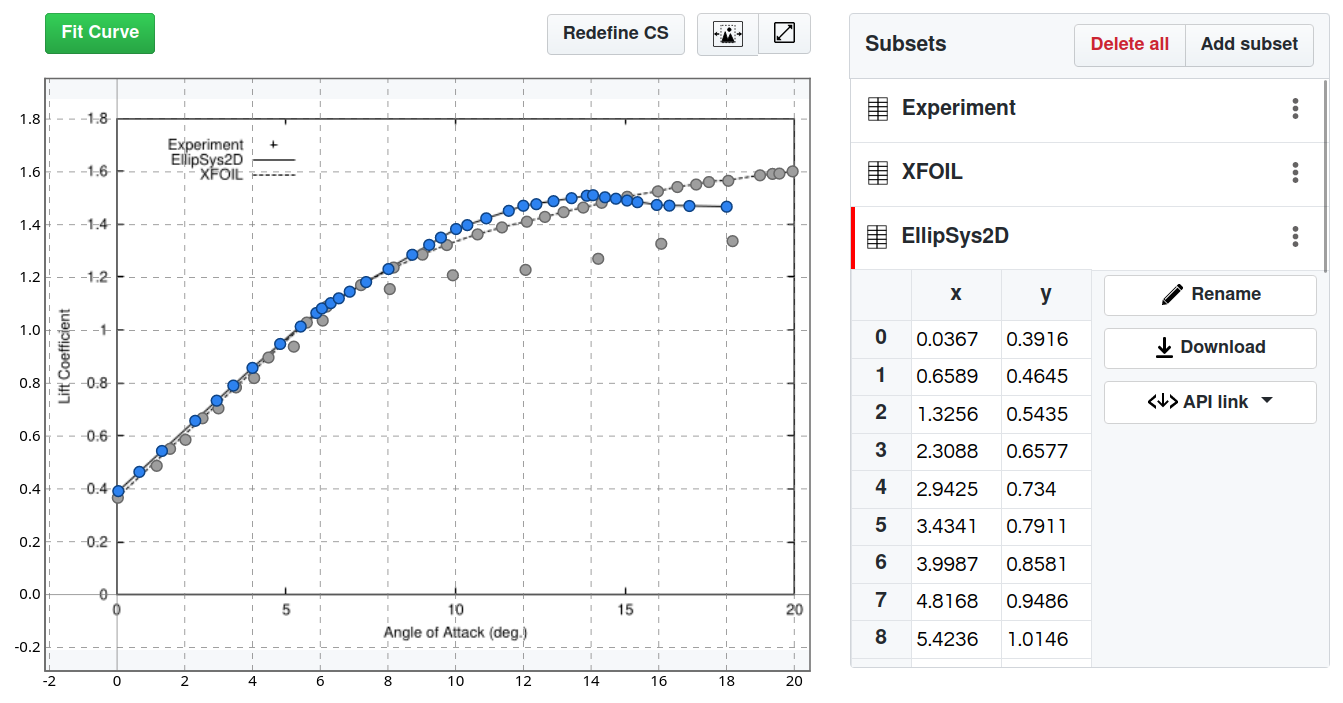
Multiple Data Ranges Extracted From Plot

The ability to reuse extracted data in external applications is another strong advantage of the SplineCloud approach. Use the "API link" buttons to get the references to datasets and subsets and pull them in your code with the help of SplineCloud API.

Excited to give it a try? Sign up for free now and have fun with our plot digitizer!


Have some questions?

leave us a message here or write to info@splinecloud.com